 0afa3eb181
Some checks failed
Build and push adguard-exporter image / build-and-push-image (push) Failing after 11m20s
|
||
|---|---|---|
| .. | ||
| .github | ||
| geolite2-db | ||
| grafana | ||
| .env.example | ||
| .gitignore | ||
| .goreleaser.yml | ||
| CHANGELOG.md | ||
| docker-compose.yml | ||
| Dockerfile | ||
| go.mod | ||
| go.sum | ||
| LICENSE | ||
| main.go | ||
| README.md | ||
AdGuard Exporter for Prometheus
A lightweight Prometheus exporter written in Go that exposes detailed metrics from your AdGuard Home instance — including DNS statistics, blocked domains, upstreams, and client data.
Features
| Category | Capabilities |
|---|---|
| API Integration | • Authenticated access to AdGuard Home API • Supports /control/status, /control/stats, and /control/querylog endpoints |
| DNS Analytics | • Total DNS queries metrics • Blocked DNS queries tracking • Upstream DNS statistics • Per-client query statistics • Query reason statistics • DNS upstream latency histograms |
| Query Log Processing | • Real-time query log analysis • Query deduplication to prevent metric inflation • Domain and query reason tracking |
| GeoIP Enrichment | • MaxMind GeoLite2 IP geolocation lookup • DNS client geographic visualization (Grafana Geomap) • DNS threat map for blocked queries • GeoIP caching for improved performance |
| Traffic Analytics | • DNS queries grouped by ISP organization • Country-level DNS traffic insights • ISP-based DNS traffic monitoring |
| Exporter Monitoring | • Deduplication cache metrics • GeoIP cache usage monitoring • Deduplication hit counters • Exporter scrape performance metrics |
| Deployment | • Customizable scrape interval • Lightweight single binary deployment • Docker-friendly deployment |
Built With
Prerequisites
Before running this exporter, make sure:
- AdGuard Home is up and running
- You have a valid AdGuard username & password (without special character (!,@,`,* etc.))
- Prometheus is configured to scrape this exporter
- Docker installed (or alternatively Go 1.20+ for building from source)
- Port
9617is available on your system
To make sure the endpoint is valid, you can check the endpoints via curl:
curl -v -u <yourusername>:<yourpassword> <ADGUARD_URL>:<PORT>/control/stats
curl -v -u <yourusername>:<yourpassword> <ADGUARD_URL>:<PORT>/control/status
curl -v -u <yourusername>:<yourpassword> <ADGUARD_URL>:<PORT>/control/querylog
After that, you should got the output like this:
*   Trying 172.31.20.12:80...
* Connected to 172.31.20.12 (172.31.20.12) port 80 (#0)
* Server auth using Basic with user 'admin'
> GET /control/stats HTTP/1.1
> Host: 172.31.20.12
> Authorization: Basic Xxxxxxxxxxxxxxxxxxxxxxxxx
> User-Agent: curl/7.88.1
> Accept: */*
>
< HTTP/1.1 200 OK
< Access-Control-Allow-Origin: http://172.31.20.12
< Content-Type: application/json
< Server: AdGuardHome/v0.107.62
< Vary: Origin
< Vary: Accept-Encoding
< Date: Tue, 08 Jul 2025 16:45:56 GMT
< Transfer-Encoding: chunked
<
Environment Variables
| Variable | Description | Required | Example |
|---|---|---|---|
ADGUARD_HOST |
AdGuard Home base URL | ✅ | http://192.168.1.1:3000, |
ADGUARD_USER |
AdGuard Home username | ✅ | admin |
ADGUARD_PASS |
AdGuard Home password | ✅ | secretpassword |
EXPORTER_PORT |
Port to expose metrics (default: 9617) | ❌ | 9200 |
SCRAPE_INTERVAL |
How often to scrape (default: 15s) | ❌ | 30s |
LOG_LEVEL |
Log Level to analyze, INFO, WARN, DEBUG | ❌ | DEBUG,WARN,INFO |
Quick Start
Run via Docker Compose
1. Create docker-compose.yml in your root dir
version: '3.8'

services:
  adguard-exporter:
    image: ghcr.io/znandev/adguardexporter:latest
    container_name: adguard_exporter
    restart: unless-stopped
    ports:
      - "9617:9617"
    volumes:
      - ./<path/to/your>/GeoLite2-City.mmdb:/GeoLite2-City.mmdb
    environment:
      - ADGUARD_HOST=<YOUR_ADGUARD_URL>
      - ADGUARD_USER=<YOUR_ADGUARD_USERNAME>
      - ADGUARD_PASS=<YOUR_ADGUARD_PASSWORD>
      - EXPORTER_PORT=9617
      - SCRAPE_INTERVAL=15s
      - LOG_LEVEL=DEBUG
2. Run with Docker Compose
docker-compose up -d
Metrics Endpoint
Once running, your exporter will be available at:
http://<host>:9617/metrics
Ready to scrape by Prometheus!
Example Prometheus Job
- job_name: 'adguard-exporter'
  scrape_interval: 15s
  static_configs:
    - targets: ['adguard-exporter:9617']
Available Prometheus Metrics
This exporter exposes the following metrics from AdGuard Home.
Core Metrics
-
adguard_dns_queries_totalTotal DNS queries processed by AdGuard Home. -
adguard_blocked_filtering_totalTotal DNS queries blocked by filtering rules. -
adguard_replaced_parentalQueries replaced by parental filtering. -
adguard_avg_processing_timeAverage DNS query processing time in milliseconds.
AdGuard Status
-
adguard_protection_enabledWhether DNS filtering protection is enabled (1 = enabled, 0 = disabled). -
adguard_runningWhether the AdGuard Home DNS service is running. -
adguard_dhcp_availableIndicates if DHCP functionality is available. -
adguard_protection_disabled_duration_secondsTime since DNS protection was disabled.
Top Queries
Metrics with labels:
adguard_top_queried_domain_total{domain="example.com"}adguard_top_blocked_domain_total{domain="ads.example.com"}adguard_top_client_total{client="192.168.1.2"}adguard_top_upstream_total{upstream="8.8.8.8"}adguard_upstream_avg_response_time_seconds{upstream="8.8.8.8"}
Query Log Metrics
Metrics generated from AdGuard query log analysis.
adguard_query_domain_total{domain="example.com"}adguard_query_reason_total{reason="FilteredBlackList"}adguard_query_type_total{type="A"}adguard_query_upstream_total{upstream="8.8.8.8"}adguard_query_client_reason_total{client="192.168.1.10",reason="FilteredBlackList"}
Upstream Latency Metrics
Histogram metrics that track DNS upstream response time distribution.
adguard_upstream_latency_seconds
This metric allows latency percentile calculations such as p95 or p99 upstream DNS latency.
Generated metrics:
adguard_upstream_latency_seconds_bucketadguard_upstream_latency_seconds_sumadguard_upstream_latency_seconds_count
Example:
adguard_upstream_latency_seconds_bucket{upstream="1.1.1.1",le="0.005"} 50
GeoIP Metrics
adguard_client_geo_queries
Total DNS queries per client enriched with geographic information.
Labels:
client– Client IP addresscountry– ISO country codelat– Latitudelon– Longitude
Example:
adguard_client_geo_queries{client="118.99.94.204",country="ID",lat="-2.969000",lon="104.744200"} 1000
adguard_blocked_geo_queries
Counts DNS queries that were blocked by filtering rules and enriches them with geographic information.
Labels:
clientcountrylatlon
Example:
adguard_blocked_geo_queries{client="118.99.94.204",country="ID",lat="-2.969000",lon="104.744200"} 306
Exporter Health Metrics
Metrics used to monitor the exporter itself.
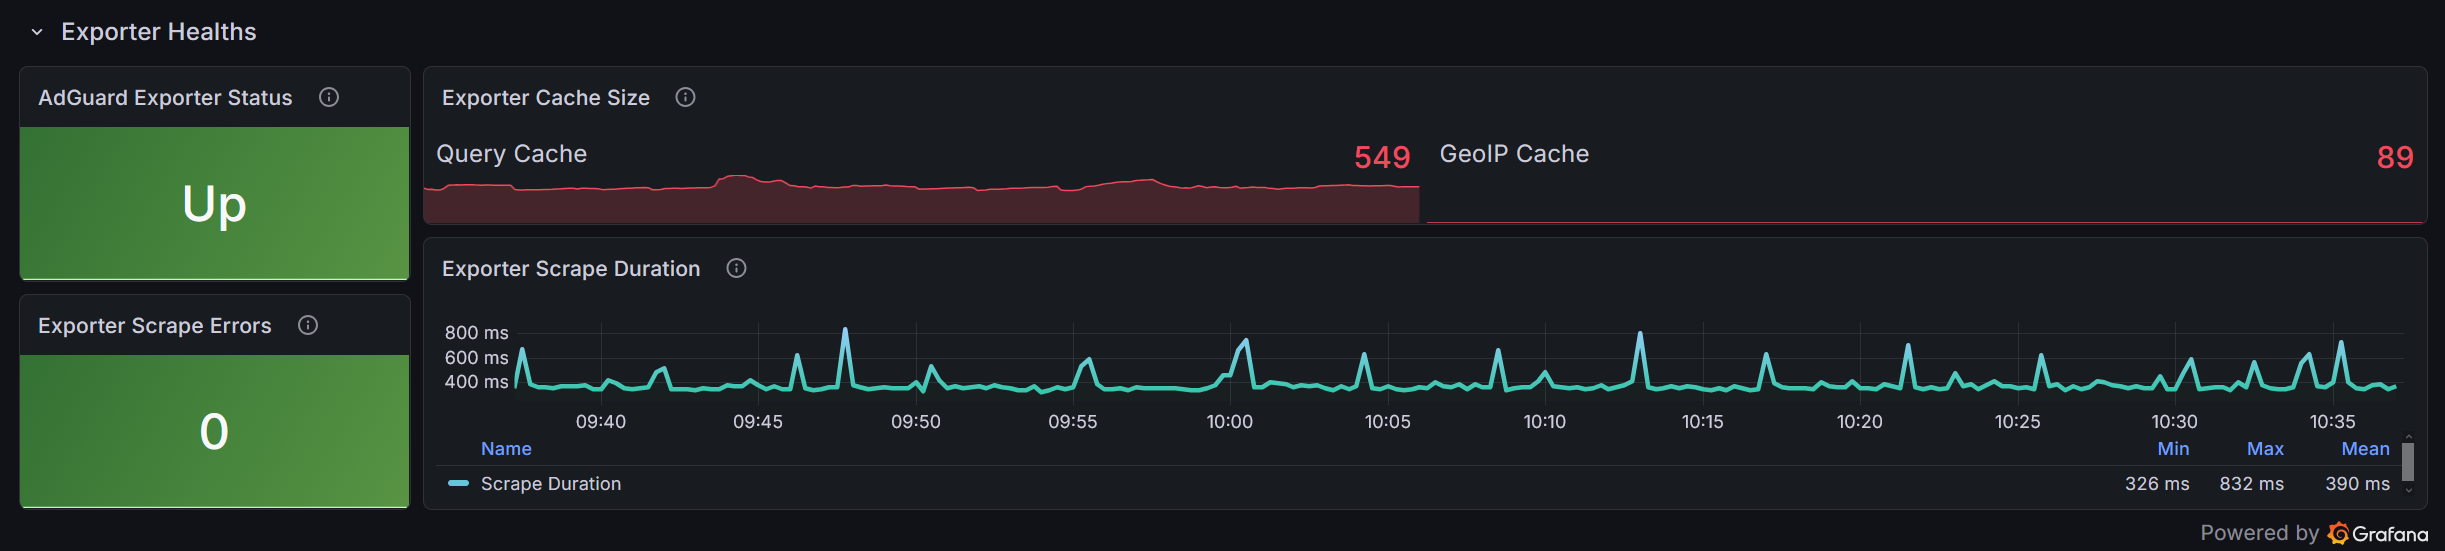
adguard_exporter_up— Indicates if the exporter successfully scraped the AdGuard API.adguard_exporter_scrape_duration_seconds— Time taken for the exporter to scrape AdGuard API data.adguard_exporter_scrape_errors_total— Total number of errors encountered during scraping.adguard_exporter_query_cache_size— Number of cached DNS query entries used for deduplication.adguard_exporter_geo_cache_size— Number of cached GeoIP lookup entries.adguard_exporter_dedup_hits_total— Total number of duplicate DNS queries skipped by the exporter.
License
This project is licensed under the MIT License — see the LICENSE file for details.
Screenshots
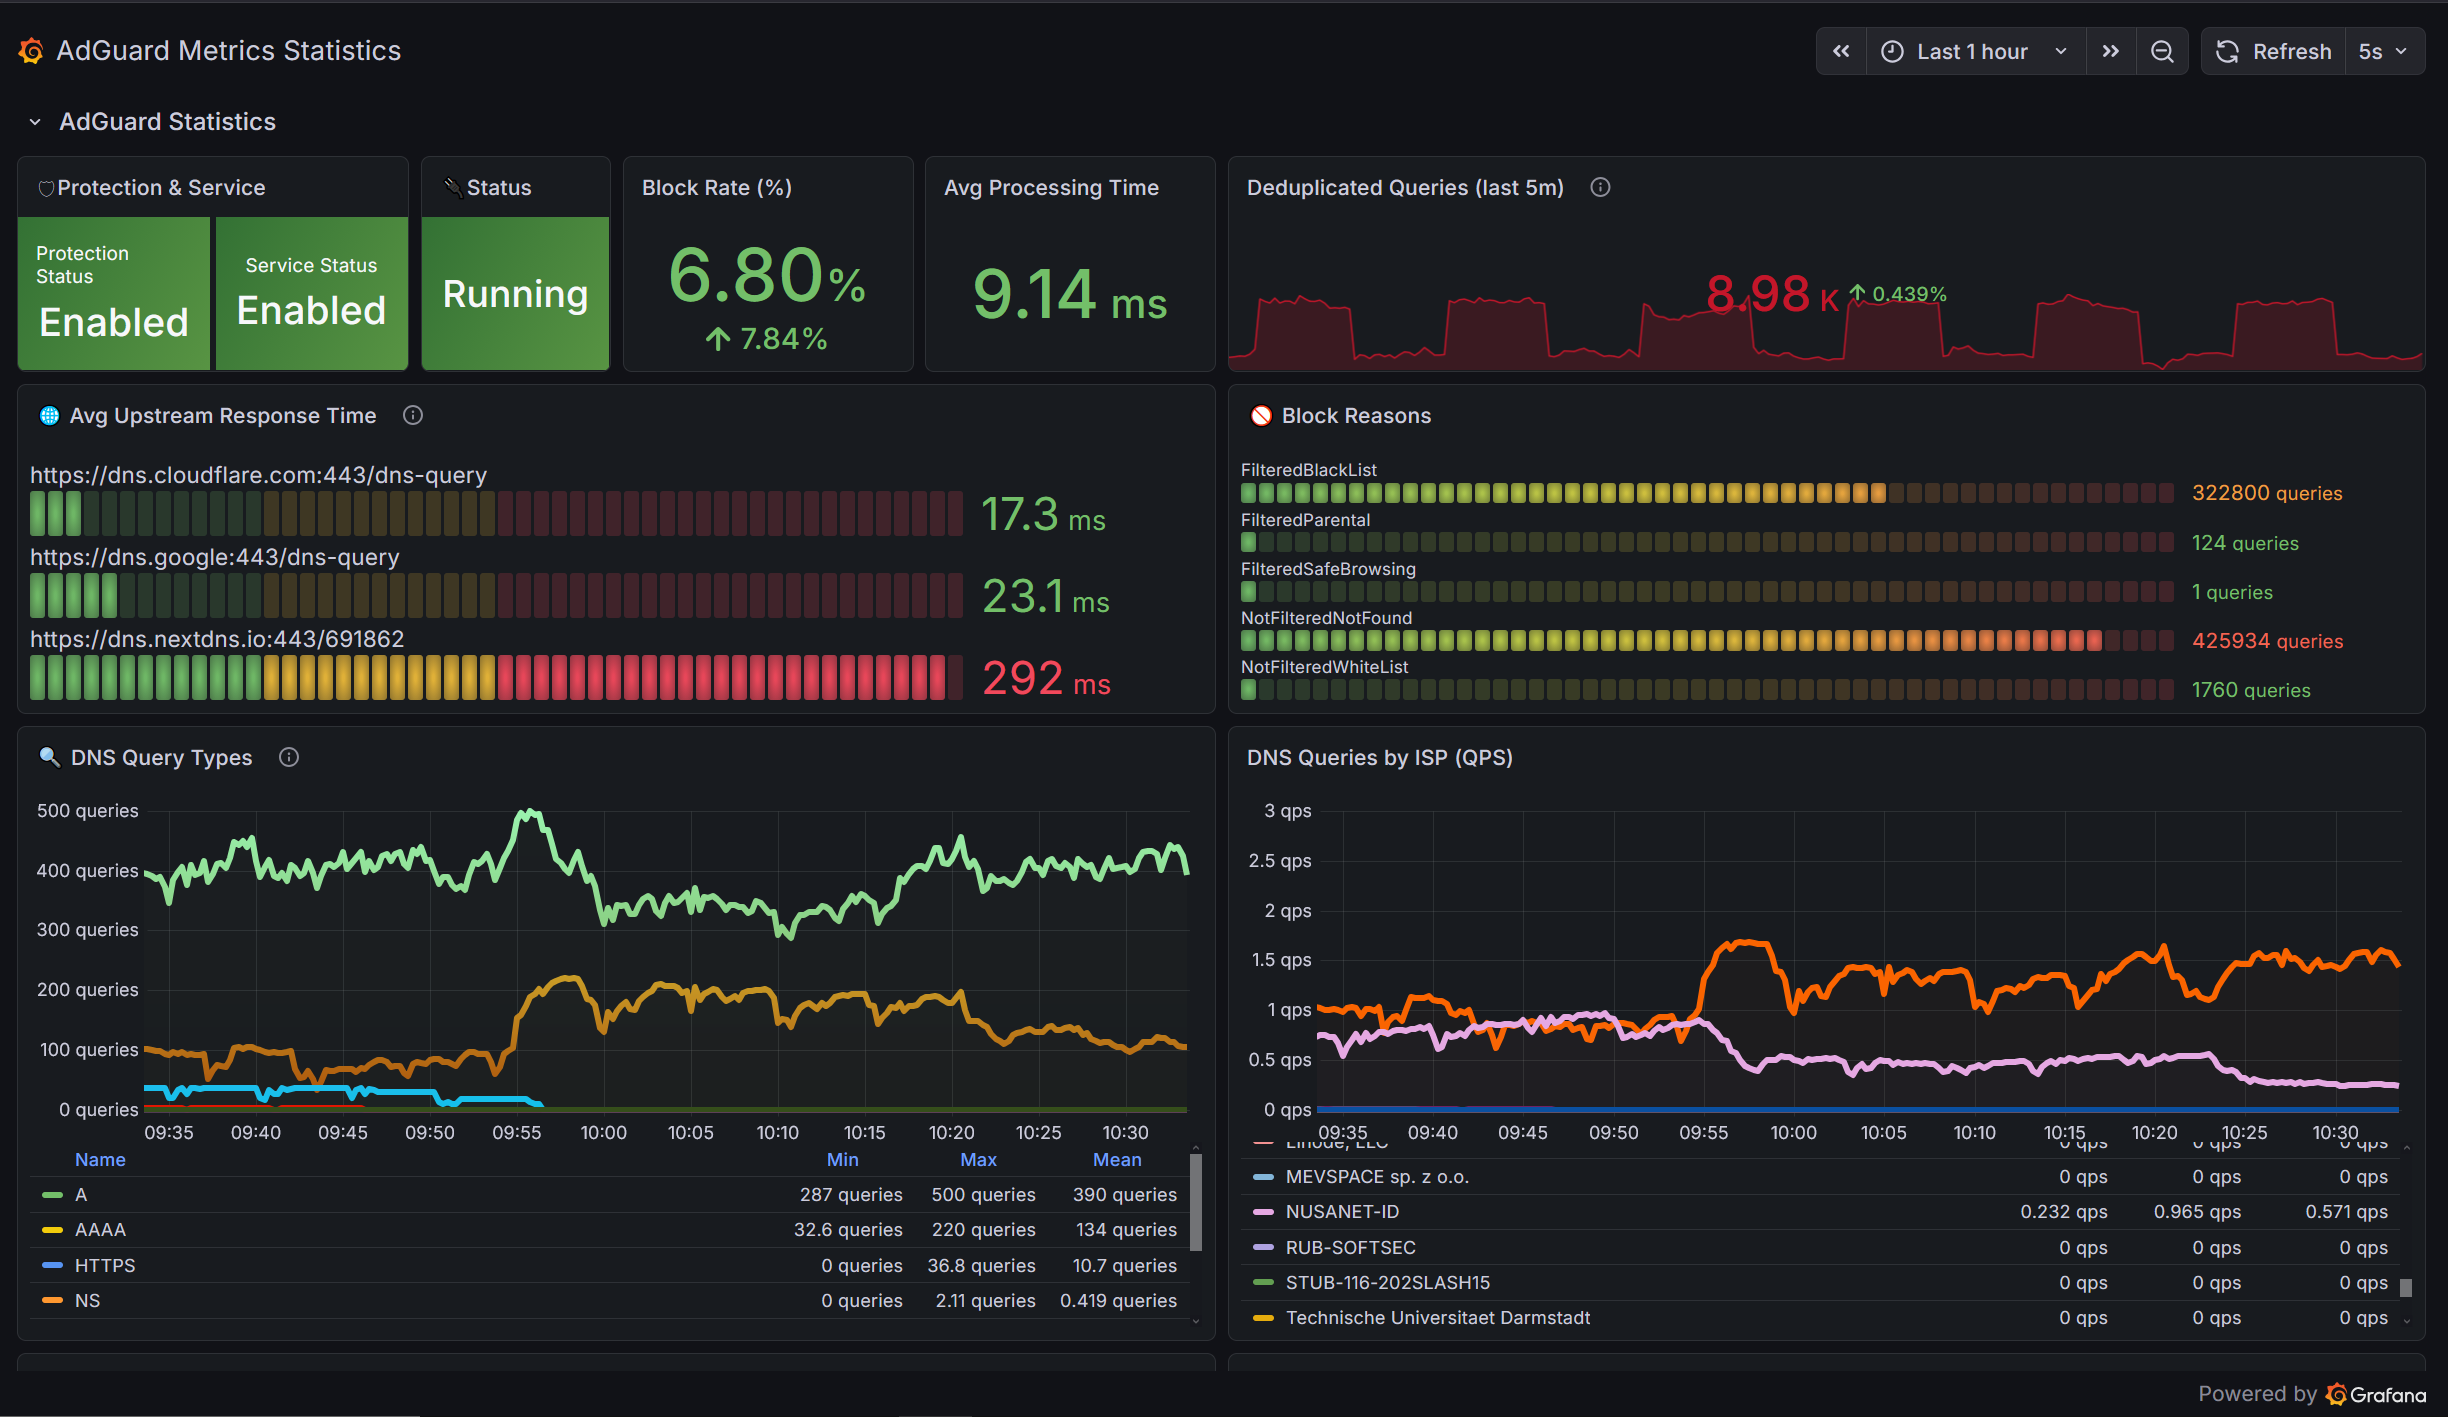
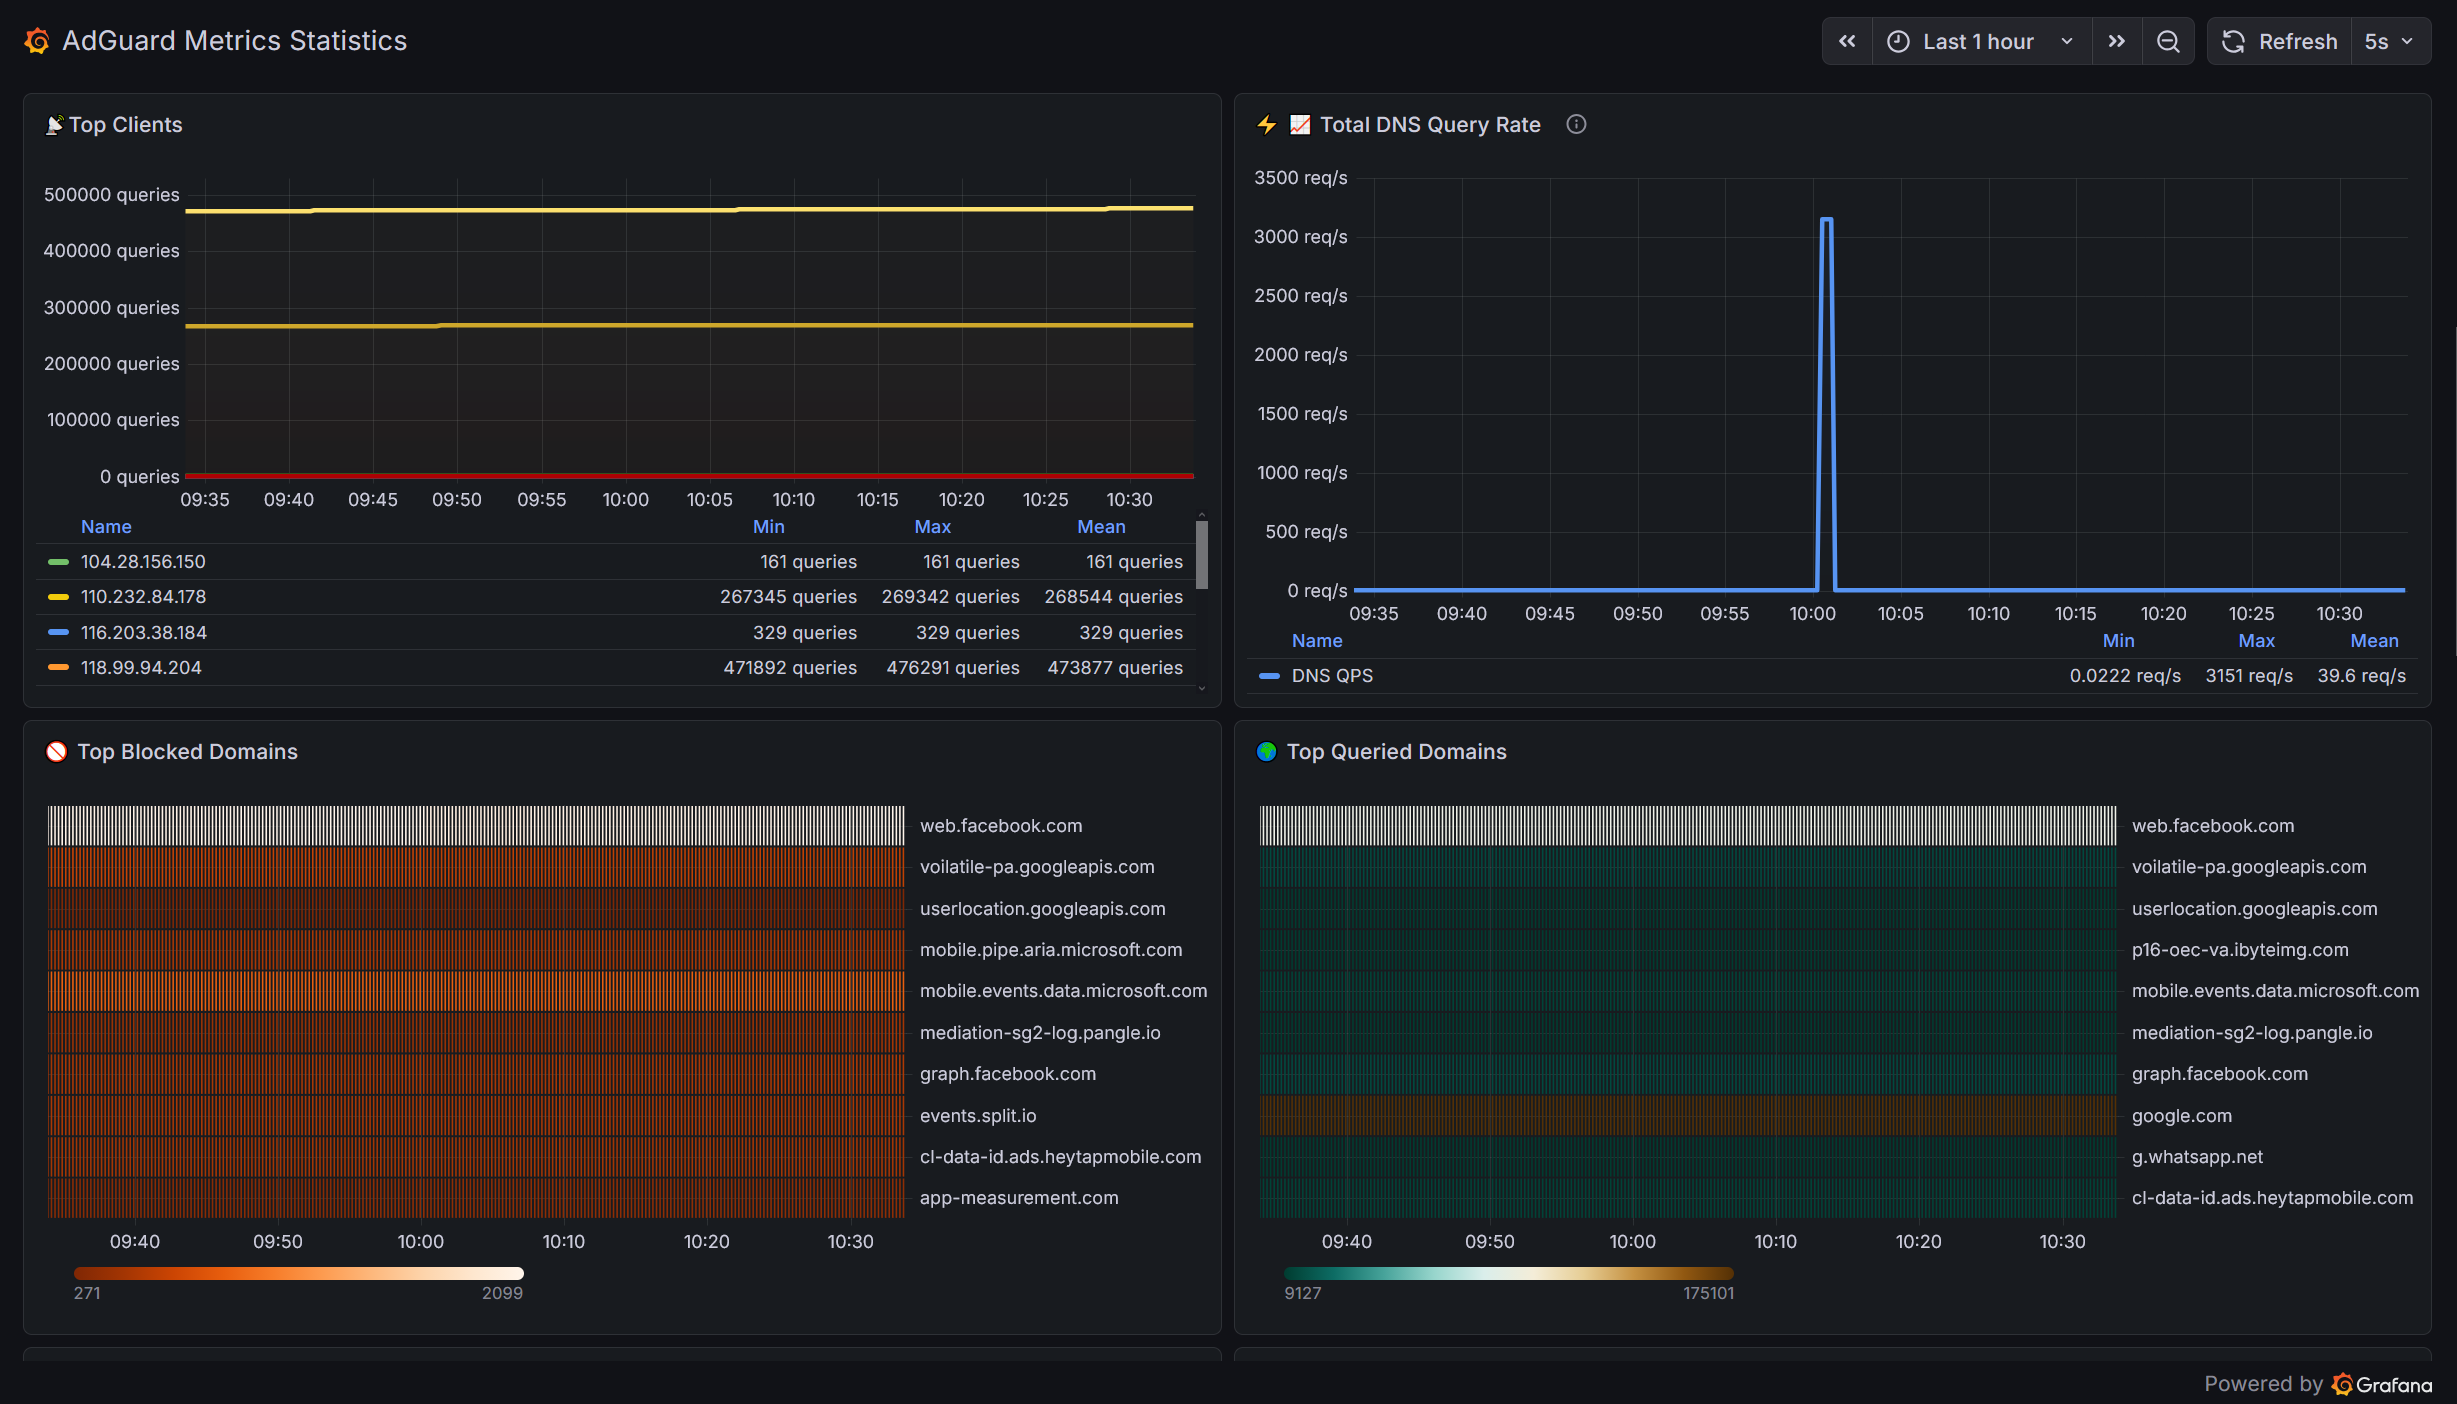
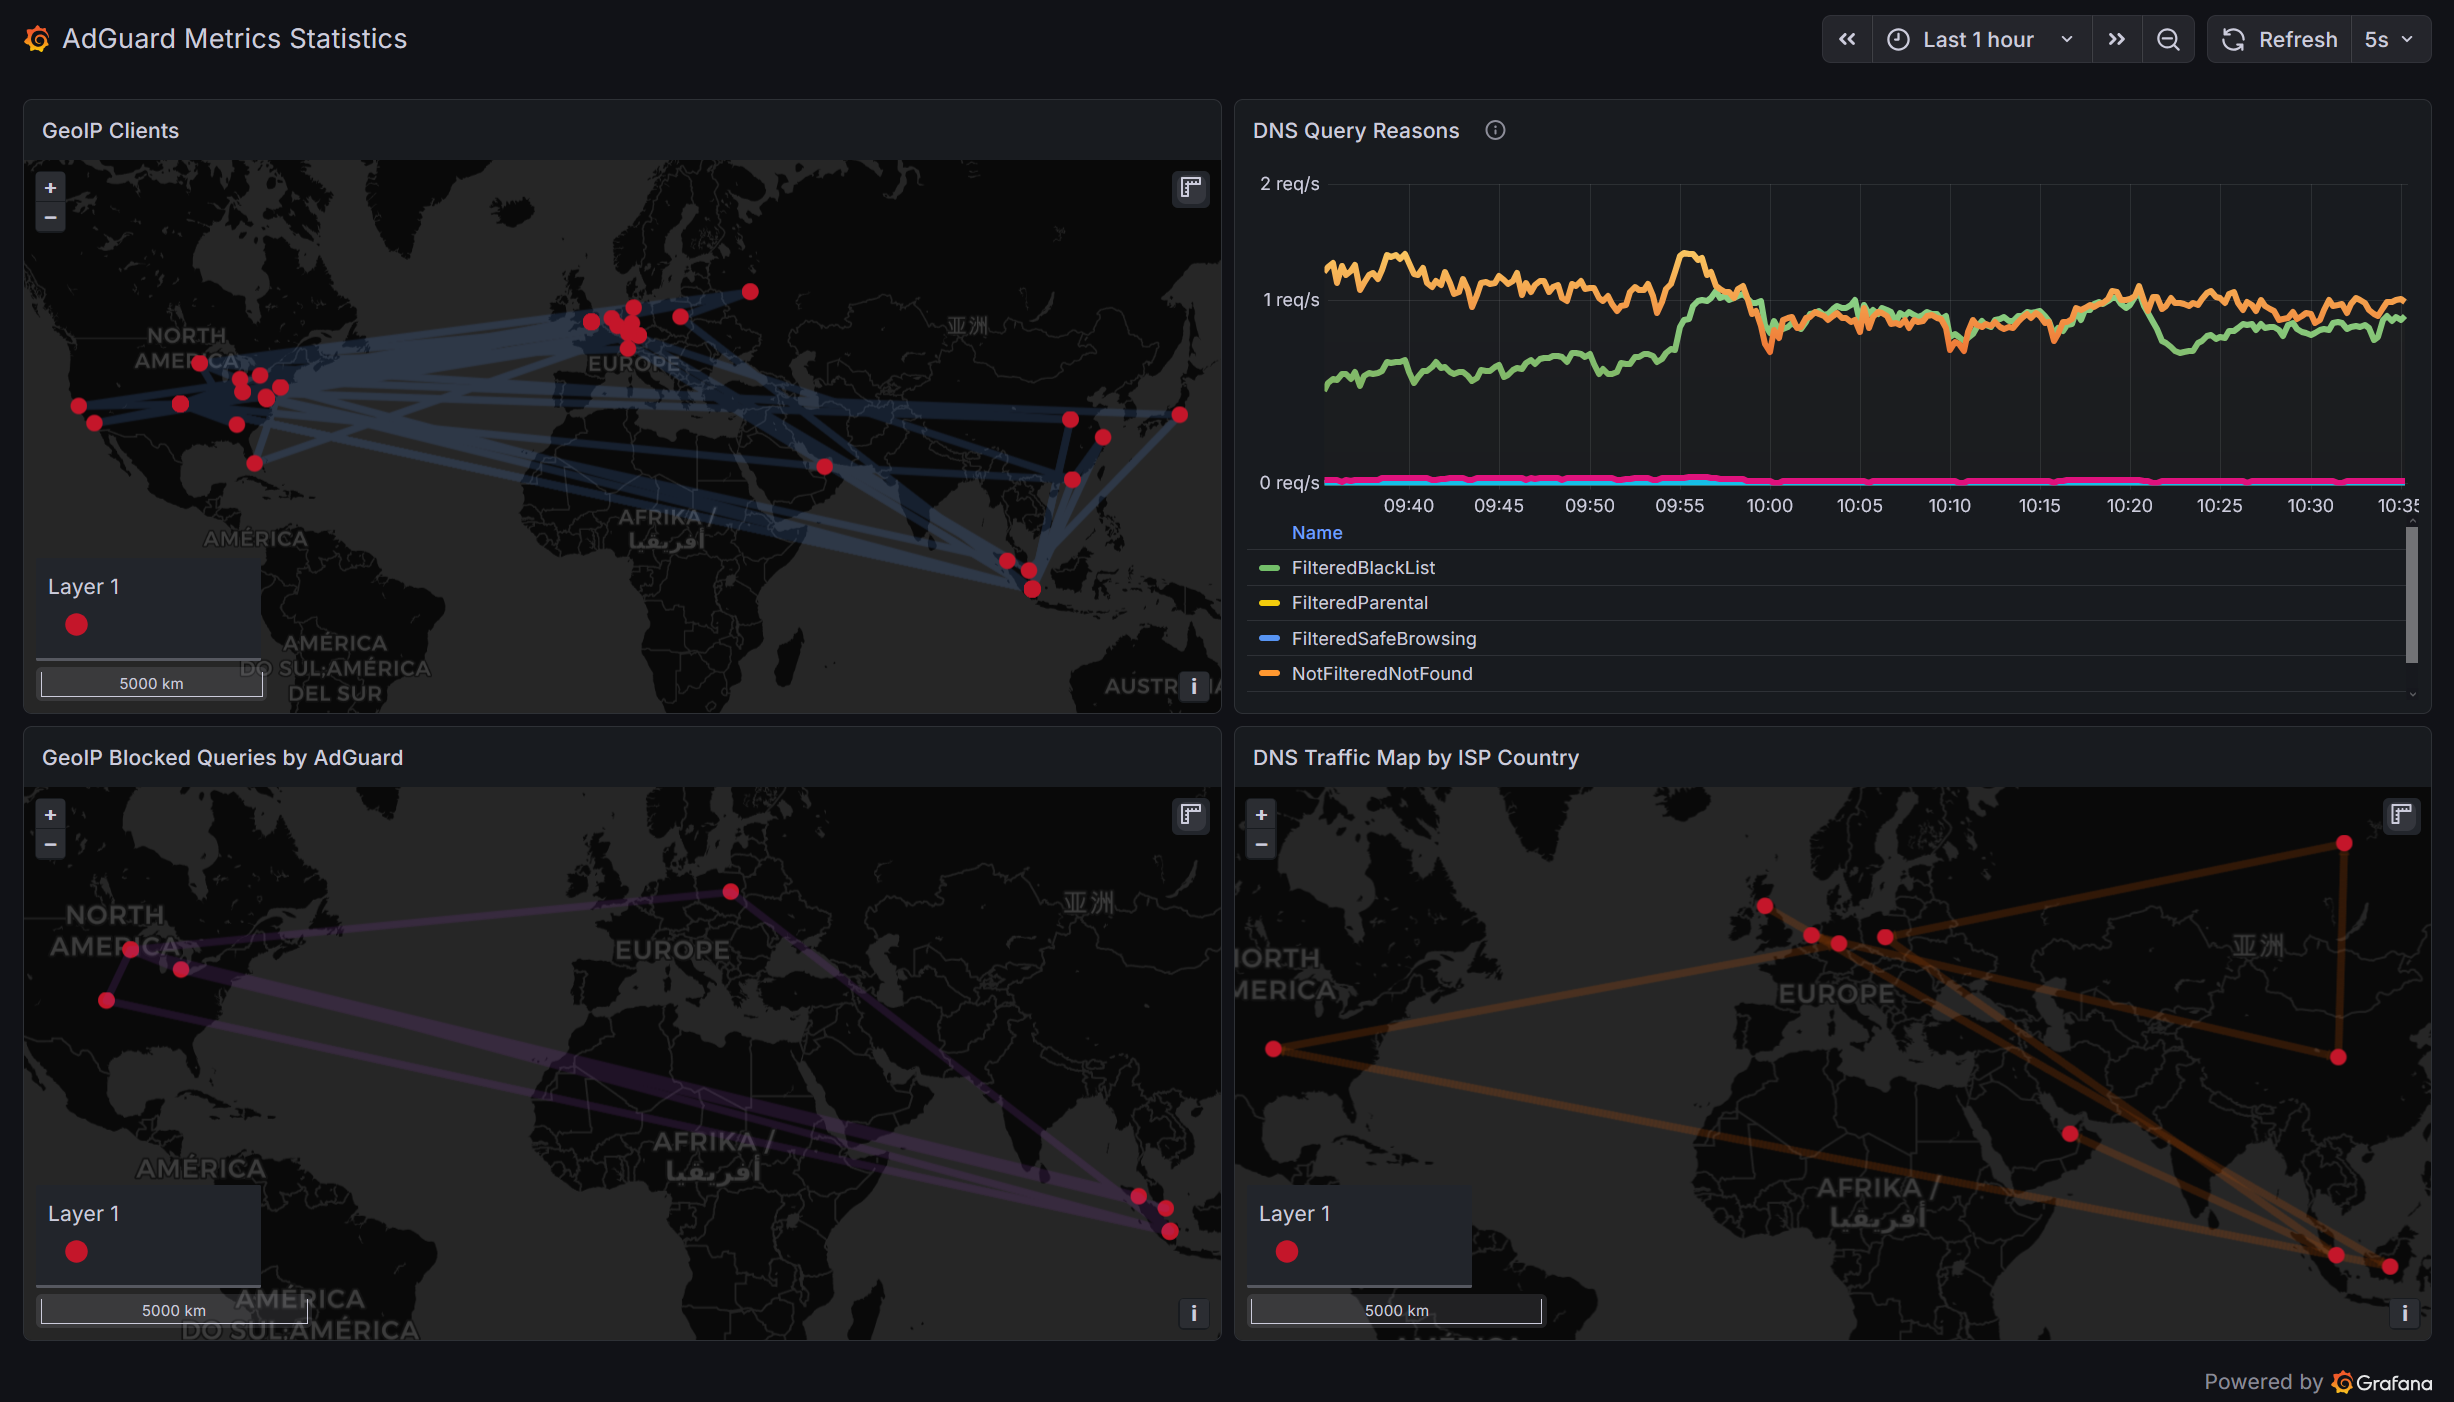
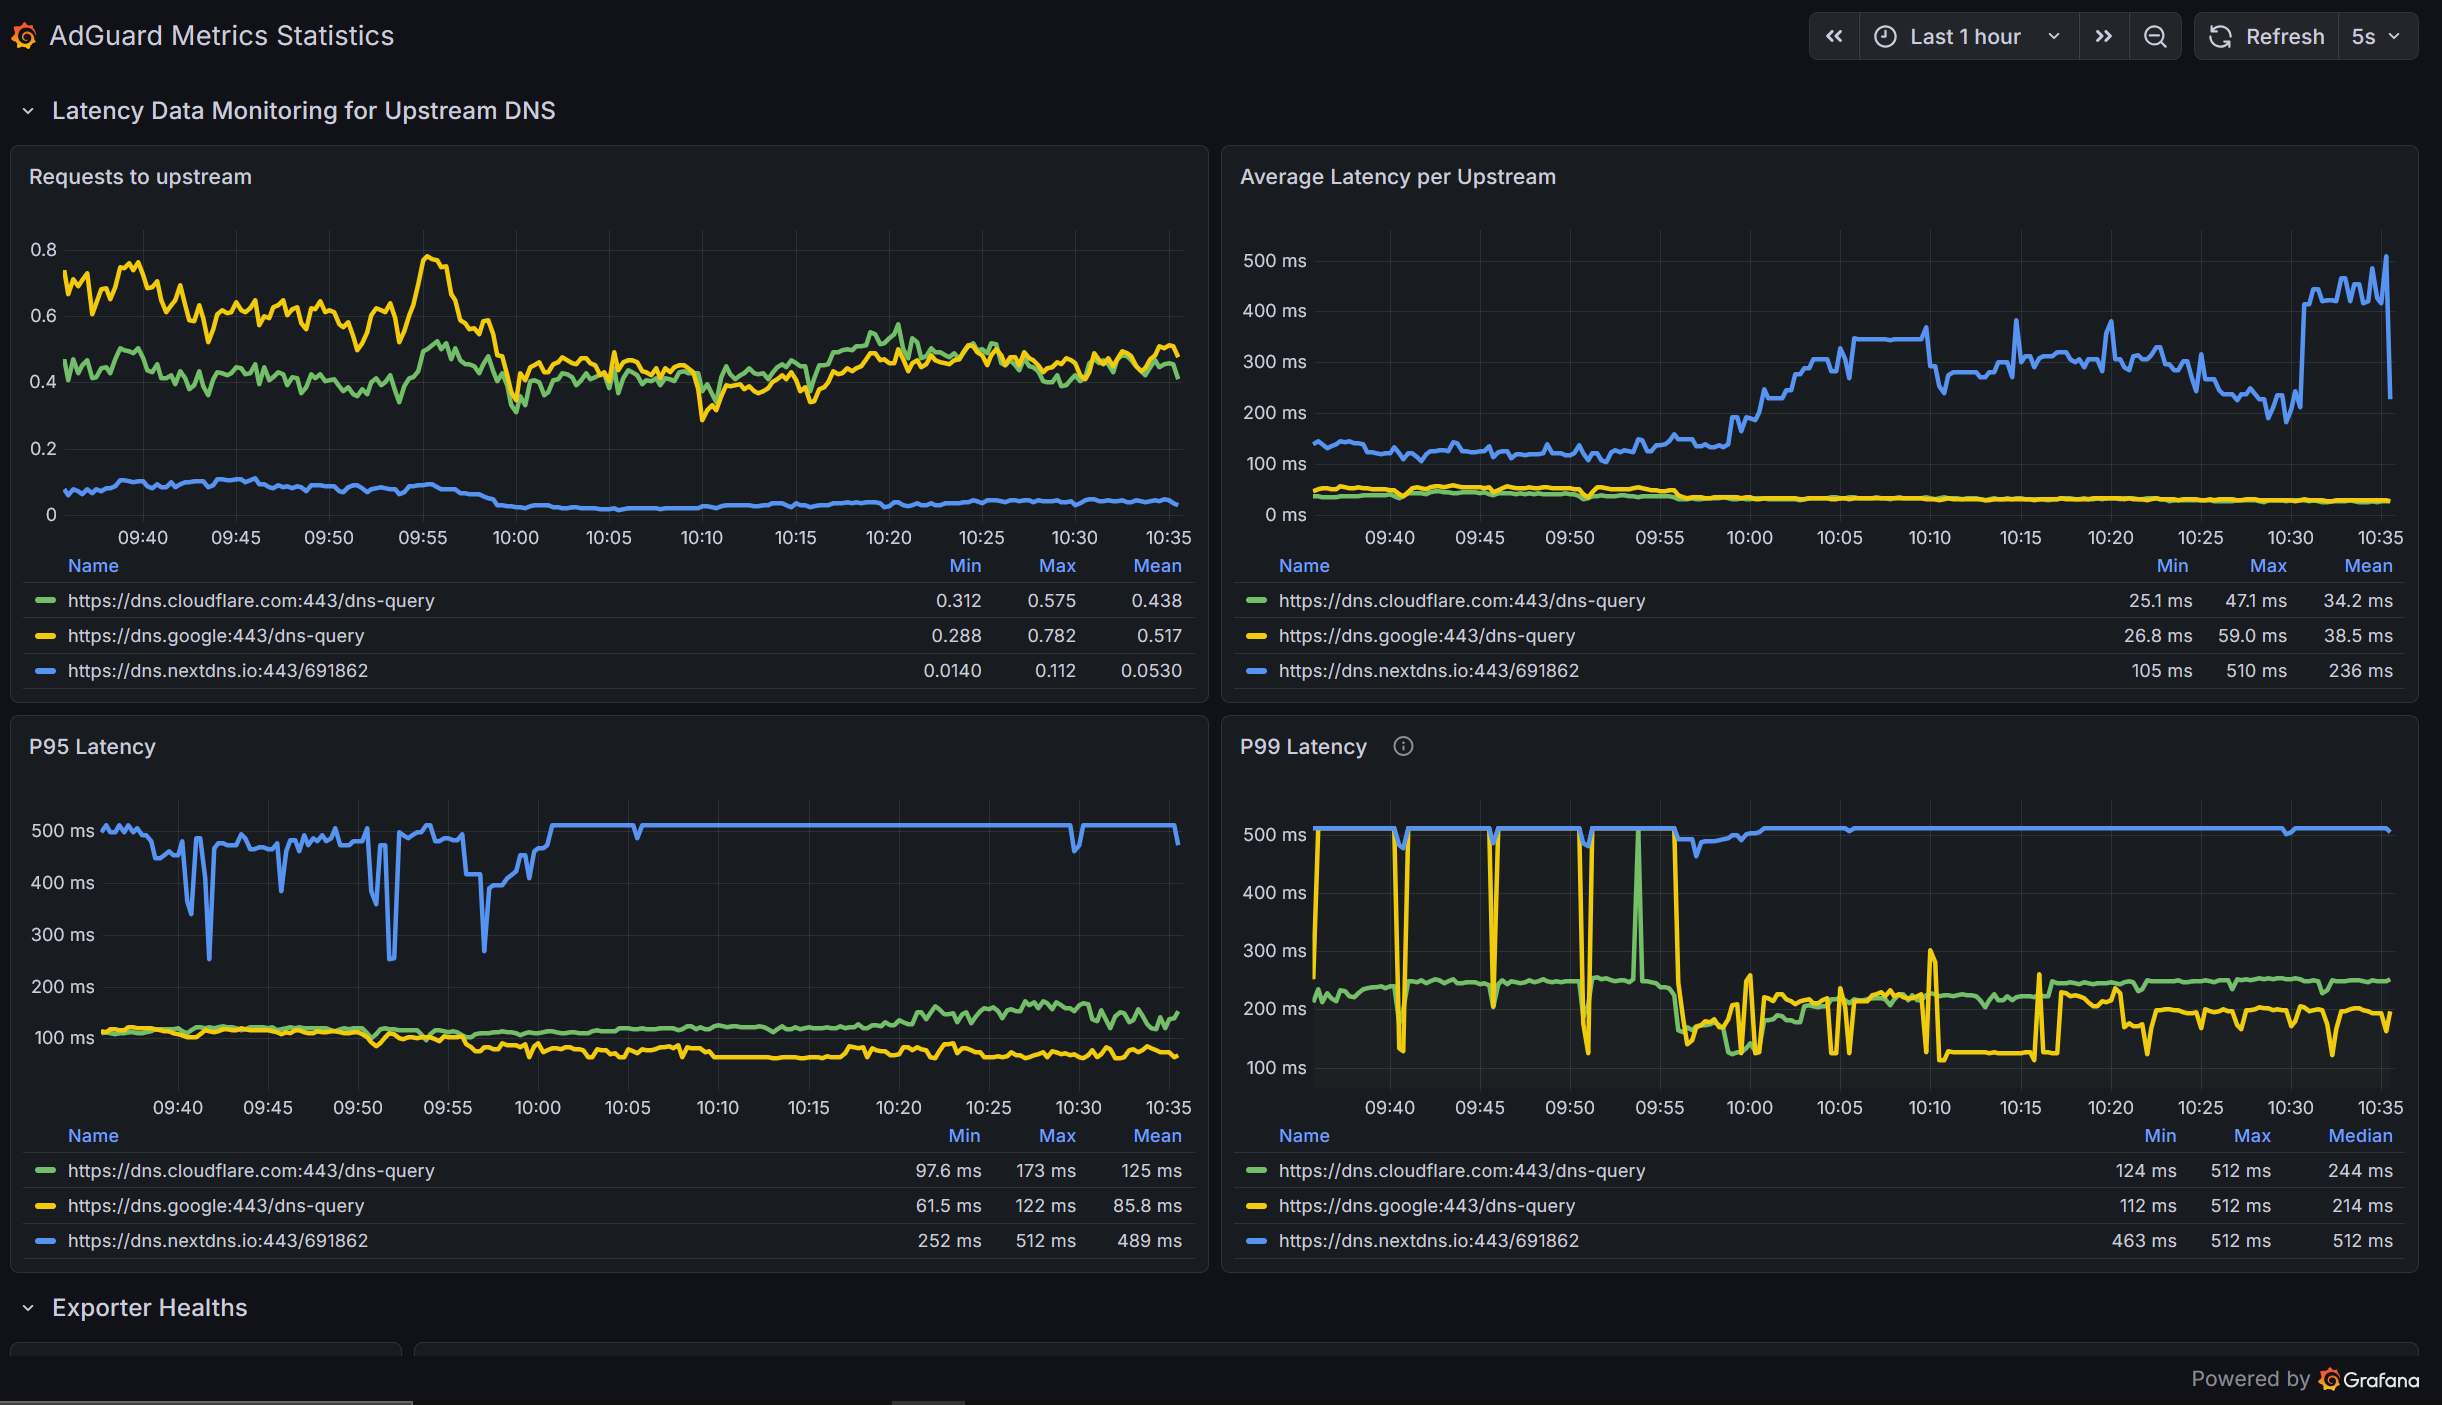
Grafana Dashboard Preview
Live preview and monitoring, click here
Deploy yours here — new dashboard.json for grafana will be uploaded soon
💬 Feedback
Pull Requests, Issues, and Suggestions are always welcome!
Made with ❤️ by znanddev